Valid for Sitecore
5.3
The Profiler
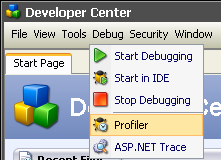
Start the Profiler by selecting Debug » Profiler from the
The Profiler allows developers to profile and trace specific pages. Pages can be selected in the DataSource tree field.
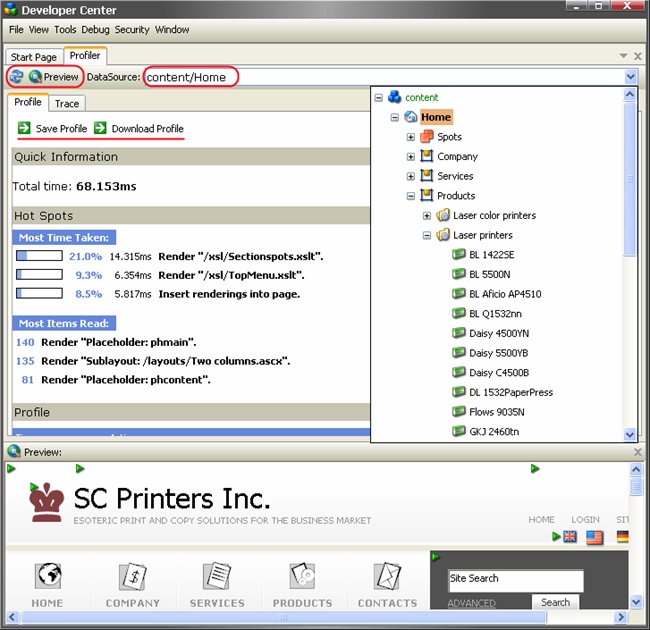
At the bottom of the profiler there is a preview window which displays the rendered output of the item selected in the DataSource field.
Profiler Toolbar
![]()
Profiler Toolbar consists of Refresh button, Preview button and DataSource field.
-
Refresh button
Click to refresh the current window and get up to date info. -
Preview
Click to toggle the Preview window on and off. -
DataSource
This field is used to specify an Item which will be used for profiling. It is required to press the Refresh button once the new Item is selected.
The information in the Profile and Trace tabs represents Sitecore Profile and Sitecore Trace respectively. Each tab has Save and Download buttons which allow to export and import debug data in XML format.